

LACTATE TESTING FOR SWIM COACHES - INTERPRETING RESULTS | |||||||||||
|
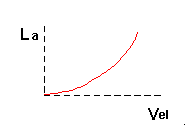
K.I.S.S. In every coaching or scientific publication you see the, now familiar, lactate-velocity curve, which attempts to simply illustrate this point. However, for many coaches, it is not simple; the challenge is to read any changes in the curve and interpret their message accurately. Only then can the test data show you how valuable it is. |
||||||||||
THE THREE VITAL COMPONENTS OF SPORTING PERFORMANCE |
|||||||||||

|
1. Endurance; the velocity during, predominantly, aerobic work - for illustrative and comparative purposes, we have chosen the time at a velocity producing 4mM of lactate (tV4), for our standard value. |
||||||||||
Each of these components combine to produce the Race Time, illustrated by the time at a velocity producing LaMax. Each of them can also change, depending on the training input. Graph 2 illustrates these possible changes. |
|||||||||||

|
Change: the only constant Changes in Endurance are seen as a change in the position of the curve, to the right or left. This movement is usually noted in the lower part of the curve - right for improved endurance, left for a deterioration.
Changes in the lactic acid value at Maximum effort (LaMax), are seen as movements in the height of the curve. When the line is higher the lactate level is higher.
Changes in the relationship between endurance and LaMax, are seen as a change in the shape of the curve. This reflects the applied Power. A "flattening", or diagonal, downward change to the right, illustrates more applied power, a "steepening", or diagonal, upward change to the left, illustrates less applied power.
|
||||||||||
Real world data |
|||||||||||

|
Endurance Graph 3 shows an improvement in endurance, illustrated by a change in position of the curve. The change is to the right. The change can be due to an improvement in any of three factors: Aerobic metabolism - more aerobic energy available per unit of timeWhatever the cause it is still an improvement in endurance - the ability to repeat or sustain exercise. If single, low-intensity swims are compared from test to test and the swims are similar in speed, it can appear that the result is a downward change in curve position. This is misleading; the swimmer is using less anaerobic energy, therefore either the same or more aerobic energy, to swim at the same speed - it is an improvement in endurance and the curve has moved to the right. If no other factor changes, then a right shift is good. |
||||||||||
|
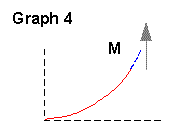
Lactate Maximum Graph4 shows an improvement in LaMax., illustrated by a change in height of the curve. The change is upward, showing that the swimmer produced more lactic acid to achieve the performance. As the graph line curves continually to the right, any increase in LaMax is an increase in speed. The cause could be an improvement in anaerobic metabolism, with the swimmer generating more energy with the same effort, or motivation, with them using more effort to generate more energy - the swimmer worked harder and pushed the curve higher. If no other factor changes, then a higher maximum is good. |
||||||||||
|
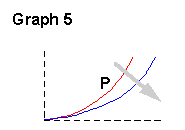
Applied Power Graph 5 shows an improvement in the relationship between tV4 and LaMax; an improvement in applied power, illustrated by a change in shape of the curve. The change is a "flattening". Improvements in applied power can arise through improvements in: Technique, or Control of existing techniqueWhichever power aspect is improved, it must be applied power. If no other factor changes, then a flattening is good. |
||||||||||
No vital component is an island The truth, the whole truth |
|||||||||||
|
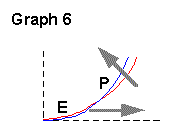
Change is bad Graph 6 shows a small improvement in endurance and a deterioration in applied power The changes can be due to any of the positive factors outlined in graph 3, and any negative changes corresponding to the factors outlined in graph 5. Technique is a factor in both endurance and power, so stroke counting will determine if the swimmer changed technique during the test. If they did, you have to identify the reason - most likely lack of concentration, or lack of strength-endurance. . The relative magnitude of the positive and negative changes will determine if the total outcome is good or bad; in this case, it is bad, but if you had tested endurance in isolation, you would arrive at a different conclusion. |
||||||||||
|
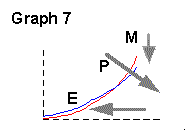
Change ... what change? Graph 7 shows a deterioration in endurance, an improvement in applied power and a deterioration in LaMax., illustrated by a change in position of the curve to the left, a flattening, and a lowering of the peak of the curve. The relative magnitude of the positive and negative changes will determine if the total outcome is good or bad; in this case, it is the same, but if you had tested any one of those factors in isolation, you would arrive at a different conclusion. |
||||||||||
|
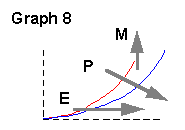
Change is good Graph 8 shows an improvement in all three components - endurance, LaMax and power, illustrated by positive changes in position, height and shape of the curve. The swimmer has succeeded in achieving the ultimate psycho-physiological-biomechanical goal - swimming as fast as possible without using lactic acid, then, when it becomes inevitable, using as much as possible and, on the way, gaining the maximum benefit from each increase in effort. The pool is full of happy, smiling people. Except the opposition! The total outcome is very good; the magnitude of each of the positive changes will determine how good. If you had tested any one component in isolation, you would arrive at a similar conclusion, but would not realize just how good it was. |
||||||||||
APPLES AND ORANGES AND HORSES FOR COURSES |
|||||||||||
|
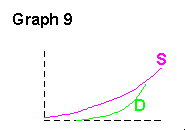
All animals are not equal Graph 9 compares typical curve shapes for a Sprinter and Distance swimmer. The distance swimmer has better endurance, less applied power and lower LaMax when compared to the sprinter. These typical qualities reflect the requirement characteristics of the different specialist events. When comparing swimmers test results for different swimmers, make sure you carefully consider the different event requirements.
|
||||||||||
|
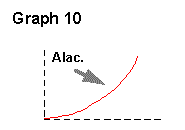
ALACTIC ENERGY SUPPLY Mad scientists start here Graph 10 attempts to diagrammatically illustrate the relationship that alactic qualities have with the lactate-velocity curve. Now, you have to suspend your sense of disbelief for a few minutes as "alactic" means, "without lactic acid", and, yet the lactate-velocity curve is, by definition, measuring lactate, which is a derivative of lactic acid. So, what we have here, is a coach's way of illustrating a concept, which may have the scientists amongst you rolling under the laboratory tables howling with mirth and derision. No matter.
|
||||||||||
Alactic means "free" speed |
|||||||||||

|

|
||||||||||
|
Published originnally March 29, 1998. All contents © Sports Resource Group, Inc. |
|||||||||||